The Audiogram
How to read an audiogram
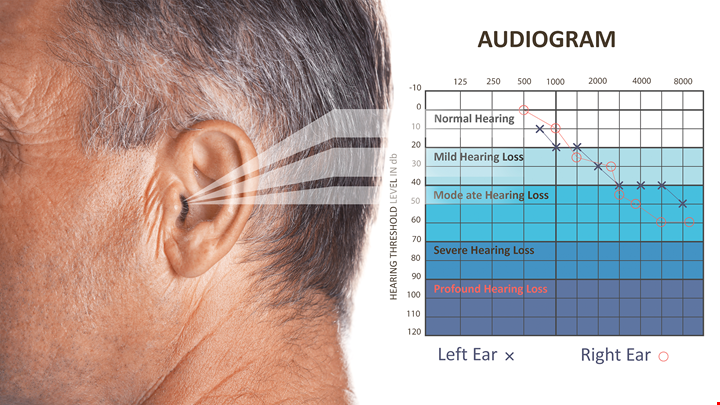
An audiogram is a graph that shows the quality of a person’s hearing. The basis of an audiogram is a hearing test.
How the audiogram is read
The audiogram shows the hearing threshold level as the softest sounds a person can hear at different pitches or frequencies. The frequency is depicted on the horizontal axis, the loudness on the vertical axis.
Different sounds are characterised by different frequencies and loudness. The graphic demonstrates this based on different sound examples. Click on the graphic to show the position of different sounds and different letters (e.g. the "s" sound is high in pitch and quiet).
The hearing threshold level divides the audiogram in to sounds that can be heard by a person and sounds that cannot be heard by the person. All sounds with a loudness/frequency position above the hearing threshold level cannot be heard. Sounds with a loudness/frequency position below the hearing threshold level can be heard. A separate line (not shown in the graph) indicates a person’s uncomfortable level for sounds, with a loudness/frequency characteristic that is perceived as too loud.